Contact sales now: info@ecommercetemplates.com
Ecommerce Templates > General Help > The Control Panel > Admin stats page
Under the Orders Admin drop down menu in the control panel, you'll find the order stats page. This is where you can check the stats for your sales and orders. It allows for filtering via date range, category, order status, country, state and payment method. You can also narrow down the orders via a particular product name, product id or affiliate.
You can also choose whether you want to display raw totals for sales and orders or if you prefer an easy to read graphical representation of your store sales performance.
Clicking on the Admin Stats link in your online control panel will bring up the sales reports page:
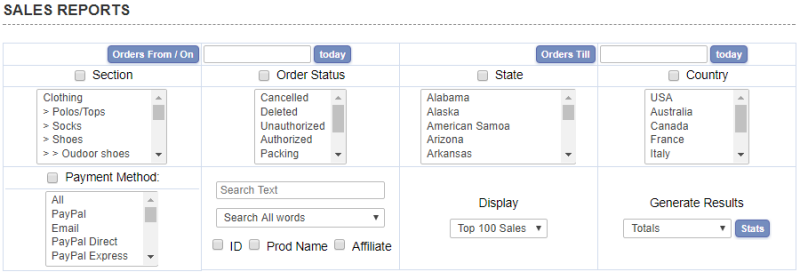
The filters here should be quite self-explanatory. Use Ctrl+Click to choose multiply selections from the same group. Select the checkbox next to the headings Section, Order Status, State etc to choose NOT to include any selections in your filtering.
In the Search Text field enter the Product ID, Product Name or Affiliate you want to filter by and select the corresponding checkbox below. Leave blank and don't make a selection if you don't want to include these particular filters. Choose the number of sales to display from the drop down "Display" - select All Sales from the choices if you don't want to limit the number of sales.
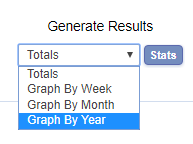
Finally choose "Totals" from the Generate Results drop down to show order and sales totals
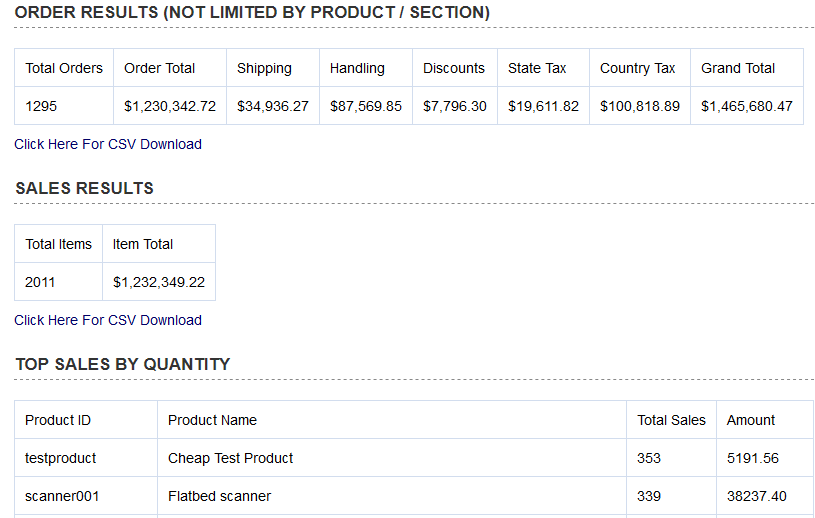
The totals provided will depend on the filtering you have applied and will include a summary of unfiltered order and sales results followed by filtered sales by quantity, sales by amount, and sales by country. Click on "Click Here for CSV Download" to download a file that can be opened up in Excel or other csv file management tool.
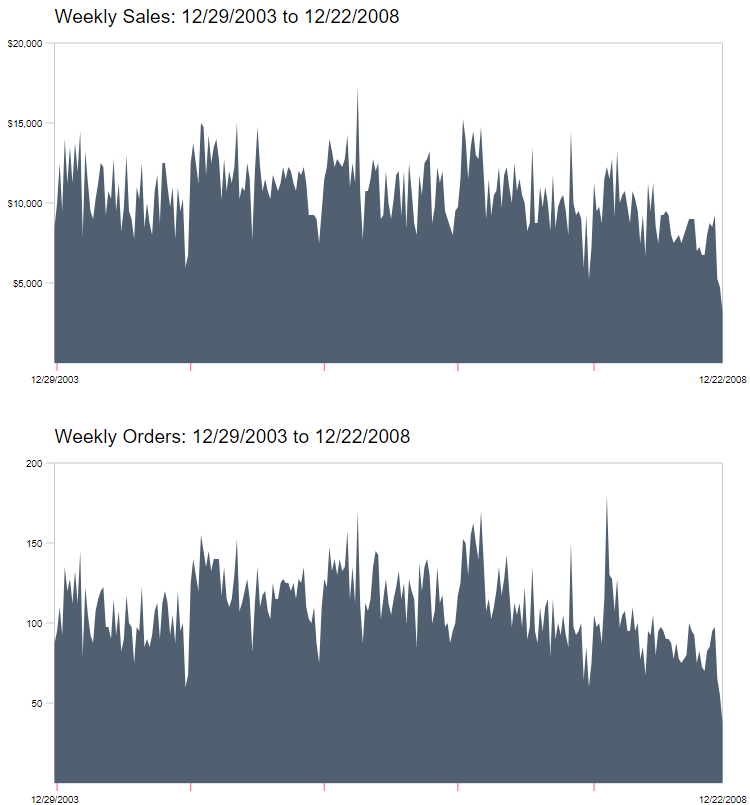
The SVG sales graphs were introduced in Version 6.8.4 and will show your filtered sales and order results. The display is responsive so will look great on your desktop, laptop or tablet.
The graphs are a great way to see how particular products have performed over time as well as providing an easy to read and interpret overview of sales and orders over time. At a quick glance, and using the available filters, you should be able to identify which products or sections are performing well, and which may need closer inspection.
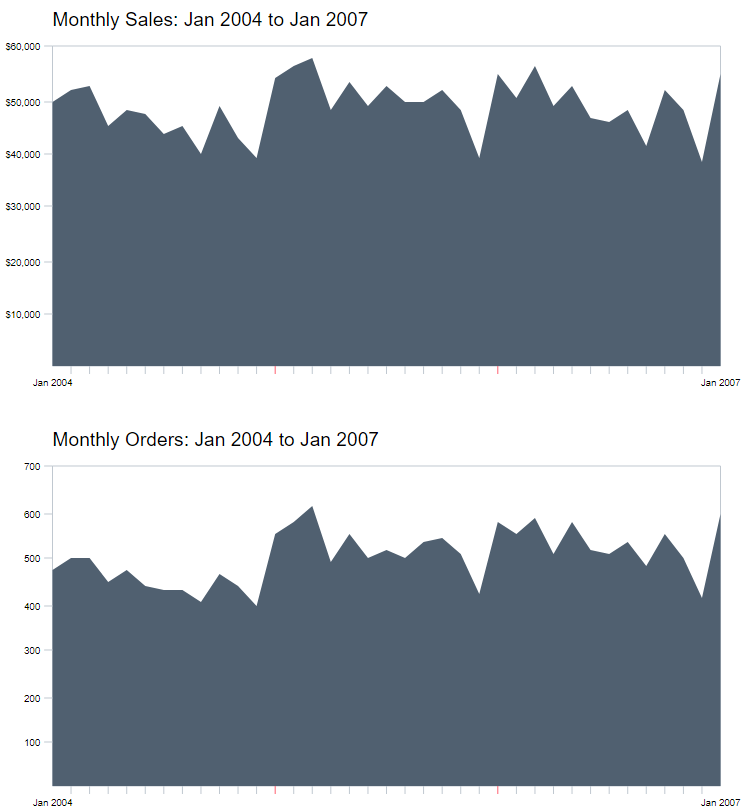
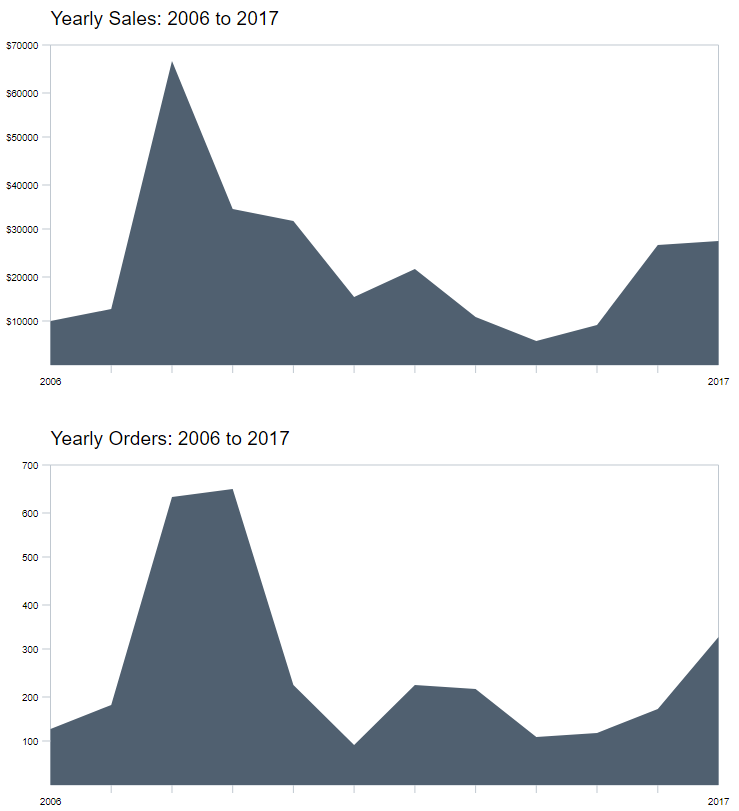
To view a graphical representation of sales and orders, choose one of the graph options depending if you want to display the weekly, monthly or yearly sales and orders